This guest post has been written by Mike from The Dividend Guy Blog. His blog is well known for high quality dividend investing articles, and for his most recent book: Dividend Growth: Freedom through Passive Income.
The first thing you should do when you want to build a dividend portfolio is to place stocks that are on your radar into 3 different quadrants. This technique is used to compare each of them and make quick decisions based on your dividend growth investing strategy. What is cool about quadrants is that they are easy to use, easy to understand and don’t require much time (I know, I’m lazy sometimes 😉 ).
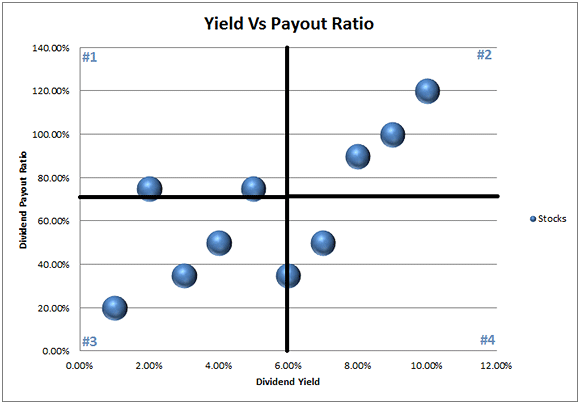
The idea of building a quadrant system is quite simple: first, you select two characteristics you want to compare (consider dividend yield and dividend payout ratio). Next, you compile the data for all your stocks with both characteristics. Once you have all the data, you simply have to position each stock according to their yield (on the X Axis) and their payout ratio (on the Y Axis). Here’s a quick example:

In this example, it is quite obvious that you would like to get as many of your stocks in the #4 quadrant (high dividend yield with low payout ratio). The less attractive quadrant is then #1 (low dividend yield with high dividend payout ratio). Within minutes, you can determine which stocks are a good addition to your portfolio and which are not.
Quadrants have been used over and over for several purposes. Companies use them to position their products (high end vs., low end, mass consumer vs., niche, etc), we will use them to position your stock. If you hope to live off dividends one day, you need to seek stocks that:
- Provide a healthy dividend at first
- Grow their dividend over time
- Grow their income over time (so they can keep up with their dividend and provide you with capital growth at the same time).
In order to find those stocks, you can use the following 3 different quadrants:
Dividend Yield Vs. Dividend Payout Ratio
The first quadrant we will look at is the one comparing the stock’s dividend yield to its ability to keep it (the dividend payout ratio). The first thing we look at as dividend investors is obviously the dividend yield. But instead of chasing blindly the yield as a dog running after a cat that just crossed a boulevard, you are better watching after the dividend payout ratio to make sure that you don’t see your dividend (or your dog) getting squished!
Because it’s always more fun when you have a true example, I’ve pulled out 10 stocks off the TSX 60 to show you how they compare on the quadrant. Here’s my data compilation:
| Ticker | Dividend Yield | Dividend Payout Ratio |
| CNQ | 1.24% | 19.21% |
| ECA | 4.05% | 39.36% |
| NA | 4.05% | 41.40% |
| BNS | 4.02% | 50.01% |
| POW | 5.18% | 61.32% |
| T | 4.01% | 62.02% |
| HSE | 4.82% | 86.96% |
| WN | 2.12% | 289.98% |
| ERF | 8.92% | 302.00% |
| PWT | 7.53% | 303.00% |
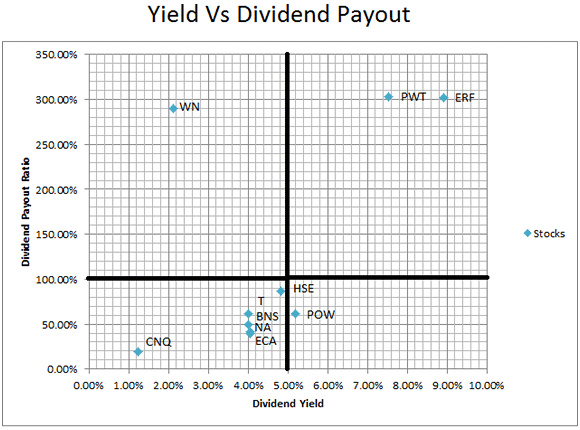
As you can see, you have some pretty high and pretty low dividend yields and payout ratios. That doesn’t mean, however, that all the low yields have a low payout ratio and vice-versa. This is what the quadrant will show you in a heartbeat:

From this perspective, the less attractive quadrant for me is the one over the 100% line. To be honest, I don’t really mind if the dividend yield is high or not at this point, because if they give more that they can then they’ll eventually have to cut on their dividend or sell assets to keep the miracle going.
In an ideal world, we would only pick stocks in the #4 quadrant as those stocks should provide high & sustainable dividend yield. Unfortunately, we only have one stock that fits in this category and it is Power Corp (POW). However, you also have some healthy dividend payers with decent payout ratio (T, BNS, NA & ECA). CNQ is not offering an interesting yield even though the company would be able to pay the distribution forever with such low payout ratio. As for HSE, it’s pretty close to not making the cut because of its high payout ratio but it should still provide some great dividends. I personally would need more time to analyze this one to see if I want this stock in my portfolio but it would not be my first pick either.
Dividend Yield Vs Dividend Growth
Once you have found companies that have sustainable dividend levels, the second thing you want to look at is how their dividend yield compares to their dividend growth. A company dividend yield could be high because it has been devalued for specific reasons or because the stock is following a bigger trend (as it is the case in a bear market for example). However, if you can find high dividend yield payers with low payout ratios and showing 5 year dividend growth; then you are getting closer to a great dividend pick!
By comparing dividend yield and dividend growth over 5 years, you want to pick the highest yield with the highest dividend growth. Continuing the same example, here are my data for the following quadrant:
| Ticker | Dividend Yield | 5 Yr Dividend Growth |
| CNQ | 1.24% | 20.78% |
| ECA | 4.05% | 19.82% |
| NA | 4.05% | 6.32% |
| BNS | 4.02% | 7.93% |
| POW | 5.18% | 8.97% |
| T | 4.01% | 12.78% |
| HSE | 4.82% | 14.66% |
| WN | 2.12% | 15.75% |
| ERF | 8.92% | -18.00% |
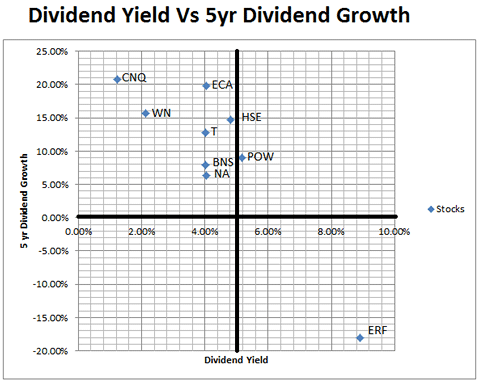
You can already guess that ERF will be out of my stock picks ;-). Please also note that I had to take Penn West (PWT) out of the following quadrant as 5 years of data wasn’t available as it was previously an income trust. Here’s the quadrant:

This time, the most interesting quadrant is #2 as it would provide stocks with high dividend yield and high dividend growth. Then again, we have POW sitting alone as an example in this category. However, we have HSE, ECA, T, BNS and NA (in this order) that are interesting. They all show an interesting dividend yield (more than 4%) while providing great dividend growth.
Another thing that needs to be highlighted is the ability of CNQ to increase its dividend significantly. Therefore, even if the dividend yield is minimal, it should catch your attention to see what happened with this stock and its dividend over time. For example, a quick research would have taught you that CNQ doubled its dividend in the past 5 years and also went from $0.05 to $0.36 dividend per share in the past 10 years. While the dividend yield is not really impressive today, the stock jumped by almost 1000% in 10 years. This is certainly something to think of before making your final decisions!
The Other Quadrants and How to Cross Reference Them
If you like this approach and would like to know more about the other quadrants you can use to pick your stocks and how to do cross referencing, you can take a look at my eBook: Dividend Growth: Freedom through Passive Income.
Cheers,
Mike
The Dividend Guy


11 Comments
Mike,
Thanx for the awesome guest post! 🙂 I’ve just finished the first 50 pages of your eBook – very impressed so far.
Cheers
The Dividend Ninja
Hello Dividend Guy!
I like the use of quadrants because it is an easy concept to understand and a very common trade-off tool in business analytics – however, something bothers me about your Husky dividend growth numbers. Since I own Husky shares, I am quite aware of their dividends. I calculate either a declining or flat rate of growth over the last 5 years (definitely over the last 4 years). Any comment? That’s why I always suggest verifying the payouts from the company’s website instead of relying on some quoted 5 year growth figures. When you lift up the covers, there is often more underneath…
Good information for those seeking enlightenment!
MG
Awesome post. love the simplicity of it!
I like the concept not only because it’s simple, it’s a great visual aid.
I just finished reading Mike’s book and I look forward to posting my review next week.
Great stuff.
It’s no wonder I enjoy the Dividend Pig and Ninja sites 😉
Cheers,
Mark
MOA, thanks! The Pig thinks you have a pretty good blog as well. 😉
Cheers