
Company Overview
![]() Family Dollar Stores, Inc. (NYSE: FDO) operates a chain of more than 6,800 general merchandise retail discount stores in 44 states, providing consumers with a selection of low priced merchandise in neighborhood stores. Its merchandise assortment includes consumables, home products, apparel and accessories, and seasonal and electronics. Most items sell in the $1-$10 range.
Family Dollar Stores, Inc. (NYSE: FDO) operates a chain of more than 6,800 general merchandise retail discount stores in 44 states, providing consumers with a selection of low priced merchandise in neighborhood stores. Its merchandise assortment includes consumables, home products, apparel and accessories, and seasonal and electronics. Most items sell in the $1-$10 range.
*Note: Family Dollar’s fiscal year ends in August. So Fy 2010 ended in August, 2010. All calculations in this analysis are based on the latest annual report, released August 2010, except for expected eps and current dividend yield.
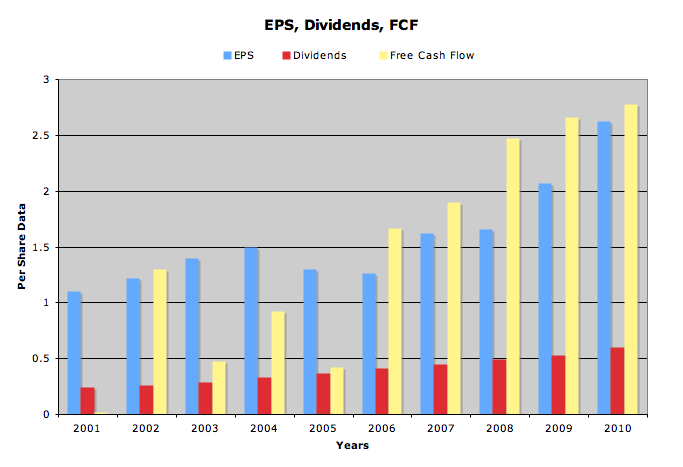
EPS, Dividends, FCF
| Annual Growth Rates | Earnings Per Share | Dividends Per Share | FCF Per Share |
|---|---|---|---|
| 10 year | 10.02% | 10.60 | 74.35% |
| 5 year | 20.08% | 9.99% | 13.57% |
| 1 year | 26.57%% | 13.21% | 4.33% |
Family Dollar is a member of The Dividend Aristocrats and has increased it’s dividend every year for 35 years. It recently announced a 16.1% increase on it’s quarterly payout to $0.18 a share.
Earnings have been grown rapidly in the last few years, due to an increases in revenue, larger margins, and a large share buyback program. EPS is growing faster than dividends, and in 2010 FDO only paid out 23% of earnings in the form of dividends. FCF has been rather erratic over the years, and though fcf per share has grown, that can be attributed more to share buybacks than major fcf growth. FDO currently has around 130 million shares outstanding, down from 172 million just 10 years ago.
Expected Earnings
- FY 2011 – 3.12
- FY 2012 – 3.61
Analysts expect FDO to grow earnings at an average rate of 13.9% for the next 5 years, while the industry average is 14.7%.
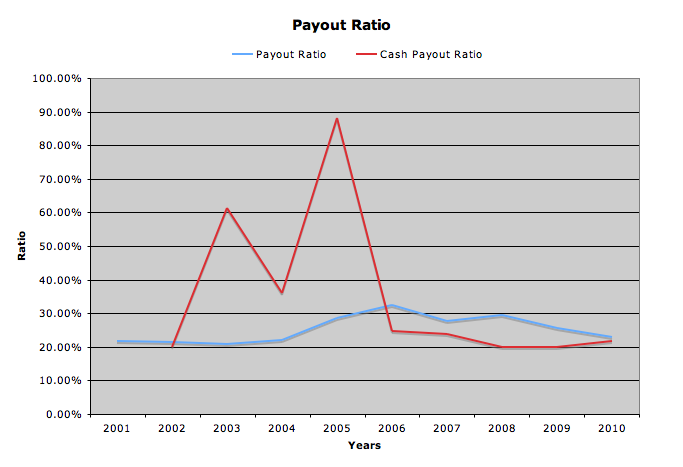
Payout ratios leave plenty of room for dividend growth, only being 23% of earnings and 21.62% of fcf as of 2010.
Revenue and Margins
| Years | Revenue (in thousands) |
|---|---|
| 2001 | 3,665,362 |
| 2002 | 4,162,652 |
| 2003 | 4,750,171 |
| 2004 | 5,281,888 |
| 2005 | 5,824,808 |
| 2006 | 6,394,772 |
| 2007 | 6,834,305 |
| 2008 | 6,983,628 |
| 2009 | 7,400,606 |
| 2010 | 7,866,971 |
Revenue has grown by an average of 8.76% for the past 10 years
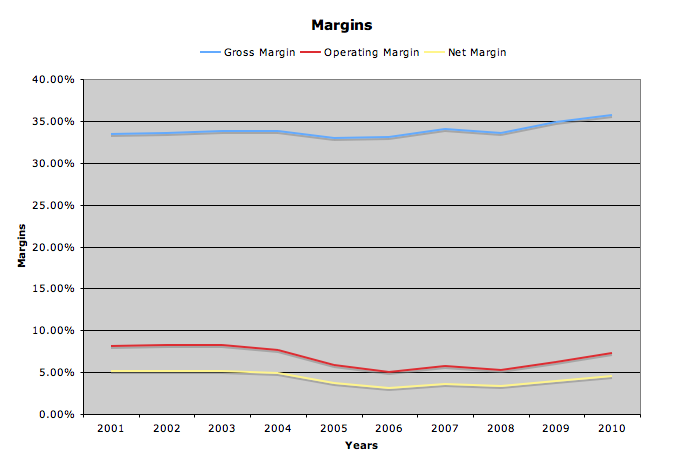
Gross margin remained stable, but both operating and net margins dipped a little in the mid 2000s. They seem to be recovering though.
Balance Sheet
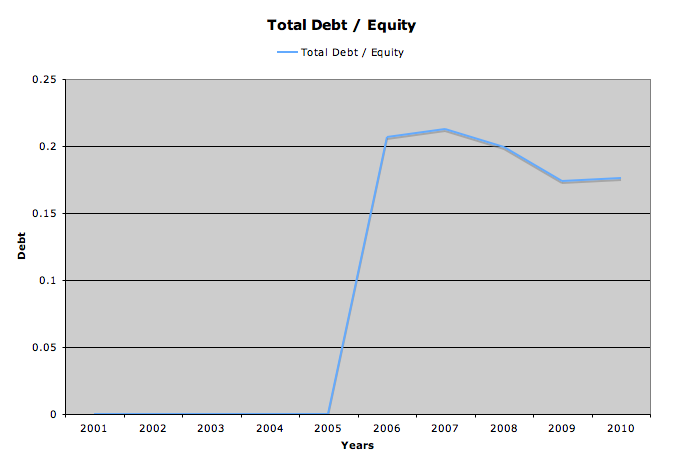
FDO’s balance sheet is very clean. Total Debt to Equity is only .18, and debt is only 14.96% of their capital structure.
The interest coverage ratio is a whopping 43.16, and the current ratio is 1.57
Returns
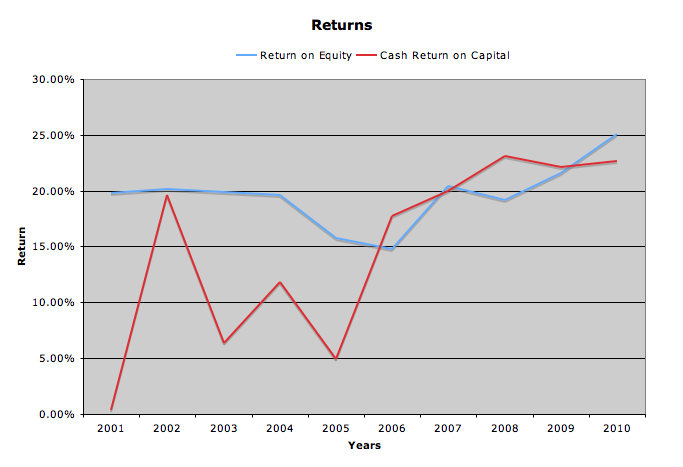
Return on equity for the past year was 25.03%, which is slightly above FDO’s 10 year average of 19.62%.
Cash Return on Total Capital last year was 22.68%, above the 10 year average of 14.86%. As shown by the graph, this has been rather erratic over the years.
Stock Price Valuations
current price – 42.93
5 year low p/e – 11.79
p/e (ttm) – 16.39
p/e (forward) – 13.76
p/cash flow – 15.47
peg – 1.18
5 year high dividend yield – 2.44%
dividend yield – 1.68%
Conclusion
Family Dollar had strong performance the past few years, as consumers traded down and looked for cheaper alternatives during the recession. They have been working hard to refresh many of their stores, and sales of it’s Family Dollar brand increased by 19% from 2009.
FDO has done a good job taking advantage of a sluggish real estate market. After focusing on operational efficiencies and same store sales for the past few years, they are ready to open another 300 stores in Fy 2011, a 50% increase from 2010.
Overall, I am lukewarm on FDO. They are in a highly competitive business, and do not have either the international diversification, or business diversification, of other retail outlets. I believe there is better value elsewhere.
For comparison, see my analysis of other discount retailers Costco, Target and Walmart
By next week I will post a comparison table of all the Discount, Variety Store companies I analyzed for January.
To get all my updates, please subscribe to my rss feed
Full Disclosure: I do not own any FDO. My Current Portfolio Holdings can be seen here
7 Comments
Even during the ‘lost decade’ they’ve consistently grown their revenue. That’s a good sign!
As you say, there is better value elsewhere, but this isn’t a bad stock to own.
Good overview DP!
Great article. Great analysis and graphs as well for visuals, they have performed well, especially with that last increase in their dividend. However, I think there are better plays that yield more than the 1.69% that they currently have, ya know? Such as Walmart maybe. Good article though, thanks for posting it!
-Lanny B.